
Status of Melbourne FL – Brevard County Real Estate
Current Status of the Brevard County Real Estate Market
Last updated 3/9/2024 with data through 2/25/2024
IMPORTANT NOTICE 3/21/2024: It has just come to our attention that due to changes in the Space Coast MLS going back to mid-December 2023, the data in graphs #1a-b and #3a-b is understated compared to prior years. We have requested that the MLS revise their reports to be consistent with previous year so that we can revise our graphs accordingly. We will not be updating this market report until there is resolution on this matter. Thank you for your patience. Below you can register for email alerts if you’d like to be informed when our reports are updated.


Whether you are a prospective homebuyer or a homeowner who may wish to sell someday, keeping tabs on the local housing market is always a good idea. Florida Coast Realty of Brevard has been tracking the Brevard county real estate market on a biweekly basis ever since the onset of Covid-19. Covid brought an unexpected spike in home sales which ultimately led to a shortage of homes to purchase. After four years, it finally appears that the housing shortage is over. Although the extremely volatile housing market might be coming to an end, Florida Coast Realty of Brevard continues to provide bi-weekly updates to our readers so that they can identify a shift in the local real estate market as soon as it begins to happen.
Most of the graphs below depict data year-over-year because real estate sales are traditionally cyclical, with a greater number of new home listings and sales occurring between mid-winter and late summer. Those of you that have been following our reports for some time will note that beginning in 2024 we dropped the 2019 and 2020 data from most of our graphs. We did this because the graphs were becoming too crowded and difficult to read. So now, the majority of graphs below show data beginning on January 1st, 2021.
Data on New Pending Sales
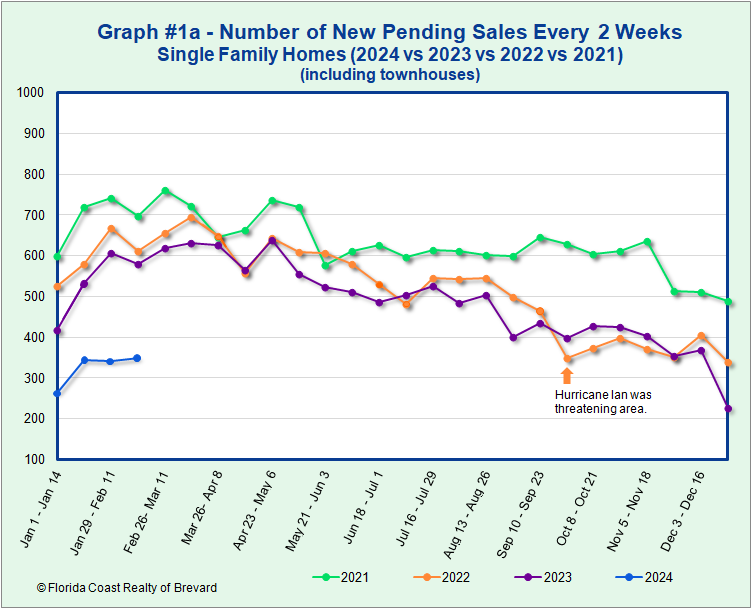
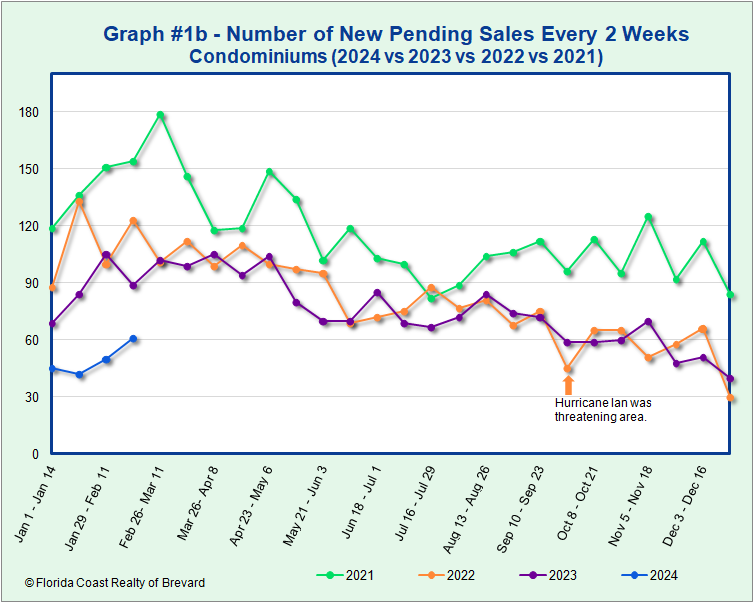
As you can see from both Graph #1a and #1b, the number of homes and condos going under contract in the first 8 weeks of 2024 is extremely low compared to the same 8 week period in prior years. Specifically, year-to-date (YTD) single-family home (SFH) sales are down 39.5% from last year, and condo sales are down 43%.
Note that there is an important distinction between the data presented in Graphs #1a & #1b, which show the number of homes “going under contract”; versus the statistic that you typically see reported number of homes “sold” (i.e. closed sales). There is normally a 4 to 8 week lag time between the time a house goes under contract and the time it closes and is marked as “sold”. Therefore, when tracking the real estate market in real-time, it is imperative to use the number of homes going under contract because if you track the number of homes sold you are pulling data this is lagging several weeks behind the behavior of home buyers.
New Listings and Available Inventory Data
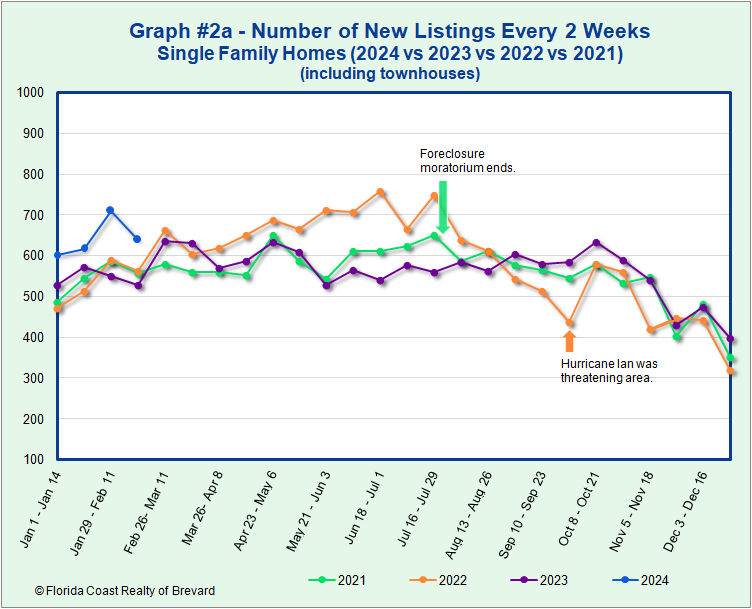
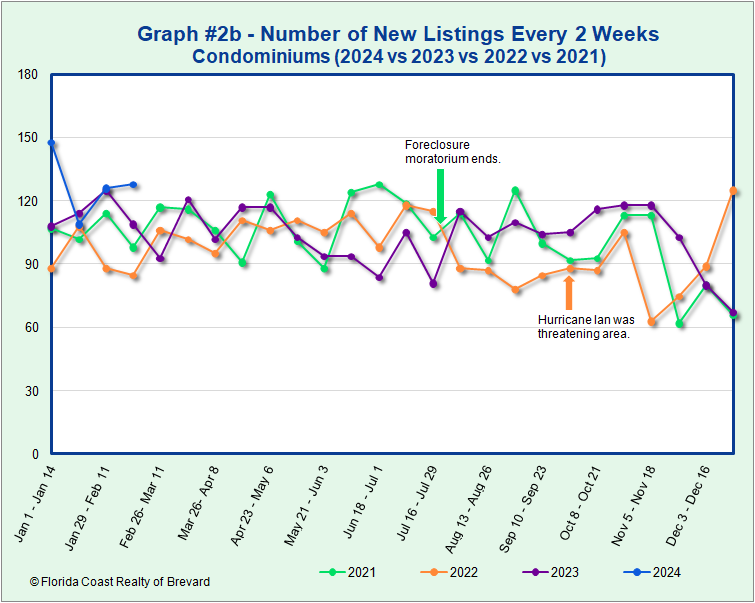
The next two graphs show the number of single-family homes and condos that were newly listed. In January and February 2024, SFH listings are higher than they were in those months in any of the previous 3 years. Specifically, SFH listings are nearly 18% higher in the first 8 weeks of 2024 than they were in the same period of 2023. It’s a bit more difficult to interpret the condo graph due to fluctuations related to low volumes, but currently, YTD listings are up 12% from last year. It’s also worth noting that the total volume of available inventory (all housing types) is up 23% from where it was just two months ago, and it’s up over 70% from where it was a year ago!
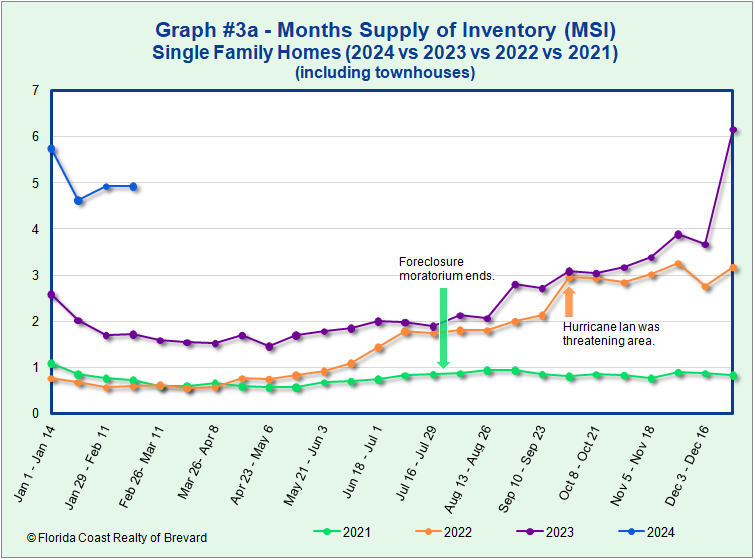
Months' Supply of Inventory (MSI)
We’ve discussed sales and listings, but to understand what that means for the overall Brevard County real estate market we need to do further analyses that look at that balance between supply and demand. Typically, the way the market works is that when supply is up and demand is down, it is easy for buyers to get good deals; and conversely, when demand is up and supply is down, sellers benefit and prices typically rise. The second set of graphs above (new listings) depicts changes to supply, and demand is represented by the first set of graphs (new pending sales). To best determine how these changes have affected the overall balance of the market, we can look to another metric used in real estate called “Month’s Supply of Inventory” which I will abbreviate here as “MSI”. The MSI reflects the number of months it would take to sell all the current inventory of homes at the current rate of sale. The formula is the total number of all active listings divided by the number of sales in the period. Typically, the number of sales used in the formula is a rolling average over the last 12 months. However, given that are trying to detect changes as soon as they begin to happen, we are calculating the MSI on a bi-weekly basis using the actual number of sales in a 2 week period and then converting that bi-weekly supply of inventory into a monthly number by dividing it by 4.2 (the average number of weeks in a month) and multiplying by 2 (since it is a 2 week period).
It’s OK if you didn’t completely understand the previous paragraph because we’re going to give you the gist of it now. The lower the “month’s supply of inventory” (MSI) the better the market is for sellers; and the higher the MSI, the better the market is for buyers. The MSI in a balanced market is somewhere around 4 to 5 months. When the MSI is below 4 months, the market favors sellers, and when the MSI is greater than 6 months, the market favors buyers.
The MSI reflects the number of months it would take to sell all the current inventory of homes at the current rate of sale.
- Lower MSI is good for sellers
- Higher MSI is good for buyers
- “Seller’s Market” defined as MSI < 4 months
- Balanced Market defined as MSI 4 – 6 months
- “Buyer’s Market” defined as MSI > 4 months
![]()
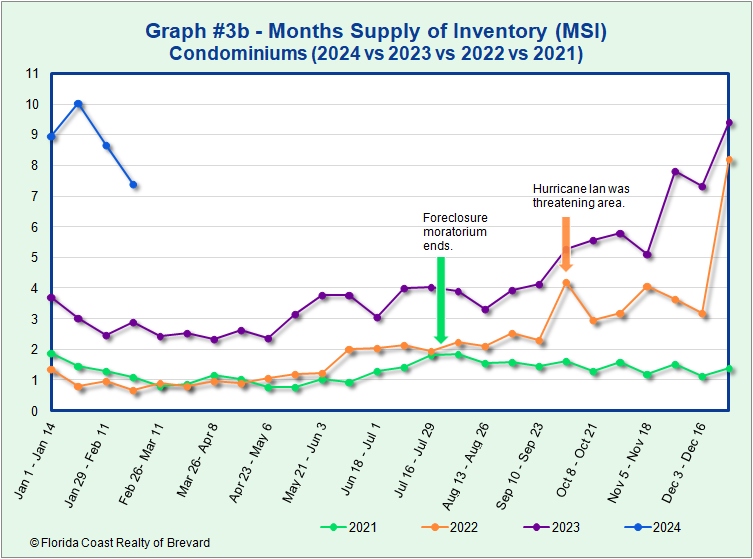
Please note, in Graphs #3a & #3b below, that the MSI was extremely low in 2021, but then throughout 2022 and 2023 both the SFH and condo MSI’s increased continuously. But, as you can see from the graphs, the jump the MSI has taken in 2024 is extreme. This high number is a reflection of the especially low number of homes going under contract so far in 2024 combined with the increasing housing inventory. Since we calculate a short-term MSI (using current sales contracts rather than using a rolling average of sales over a 12 month period), the number is subject to swings in months with unusual sales volume. Note that in December of the last 2 years, there were also spikes in the MSI. But while this was due to the typical decrease in sales volume over the holidays, I don’t know of a reason why the number of homes going under contract in the first 8 weeks of the year would be so low. This is definitely something we will want to keep an eye on.
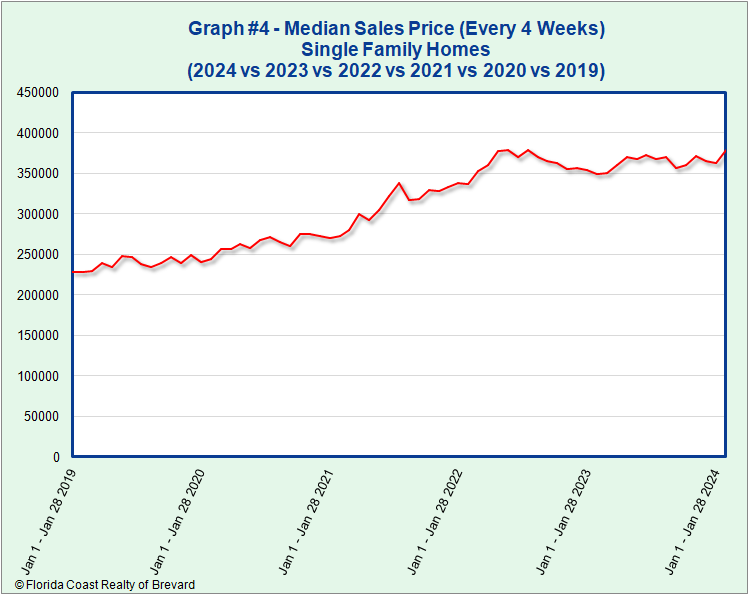
Trends in Sales Price
In a strong sellers’ market, prices are likely to rise at a higher than normal rate– and they certainly did when the housing inventory was dropping! Traditionally in a balanced real estate market, we would expect around a 3-5% annual increase in home prices. But in 2021 through the beginning of 2022 when demand was high and inventory was extremely low, prices were skyrocketing! (See graph #4.) In the first 5 months of 2022, single-family home prices were approximately 25% higher than the same period of 2021. Prices peaked in May 2022 (from homes going under contract in March & April) but after that prices began falling. By January 2023 they were down about 9% from their peak. But beginning in late March 2023, prices started slowly climbing again. And now for nearly the past year, prices seemed to have mostly leveled off. A year is a long time with no appreciation in the housing market, but we could consider it to be a price correction for the unusually high appreciation that we saw in 2021 and 2022.
Notes:
1) The final sales price on a home is not published until the sale actually closes, and since it typically takes 30 to 45 days after a contract is signed for the sale to close, any price changes we see in the graph, actually reflect what buyers were paying 4-6 weeks prior.
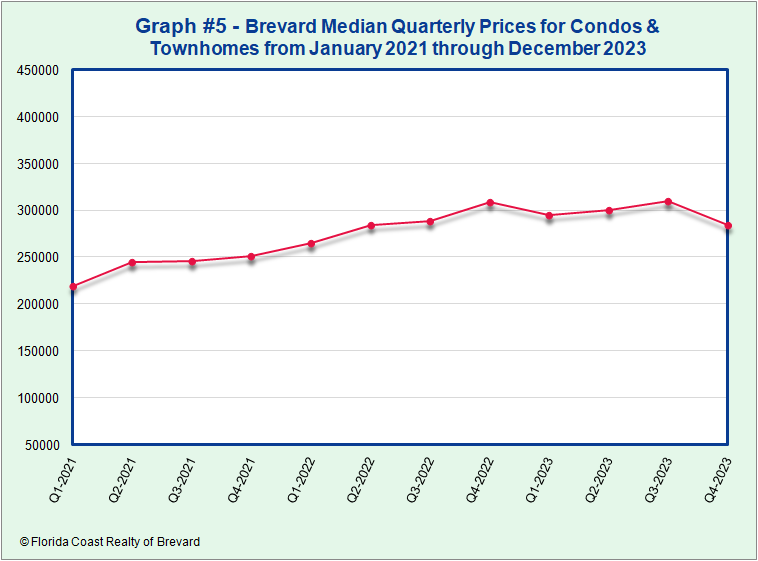
2) We have not displayed a biweekly graph for condos because the relatively low number of condo sales combined with the wide range of condo prices makes those prices difficult to interpret in the short-term. However, in graph #5 we are reporting Quarterly price data for condos & townhouses, which is provided by the Florida REALTORS® approximately one month after the quarter ends.
Below is Graph #5 which shows the trend in the median condo/townhouse prices on a quarterly basis for the last 12 quarters. The median price of condos and townhomes in the 4rd quarter of 2023 is down 3% from a year ago.
Brevard County Real Estate Market Outlook
Ten weeks ago the SFH MSI jumped up considerably (14 weeks ago in the case of condos). This is due primarily to weak sales. And while that is expected during the holidays, it doesn’t explain why the MSI is still so high in the first 8 weeks of 2024.
In December I predicted that the SFH MSI would settle at around 4 months in January and then slowly increase from there, and my previous prediction for the condo MSI was that it would settle at around 6 months in January before slowly increasing. Four weeks ago I still thought it was likely that the MSI’s would settle approximately where I predicted but would take a longer to get there. However, now I’m not so sure! If we don’t see sales pick up before the end of March I fear that the Brevard County housing market may be headed for what some might call a “crash”.
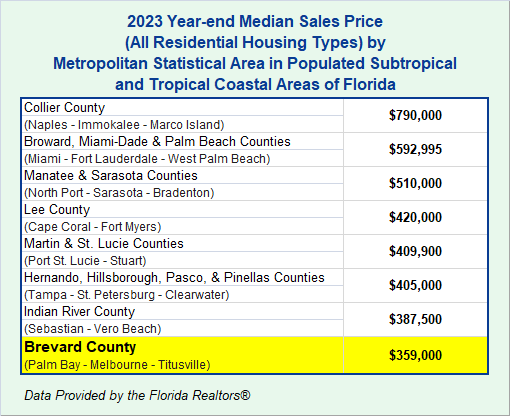
Regarding housing prices, despite the increases in the MSI for both SFH’s and condos, prices have been holding pretty steady for over a year now. I don’t expect that in the short-term prices will drop much, from where they are now. If you compare Brevard County to other coastal areas in Florida, our prices are still below all of the other populated, warm-climate coastal areas (see chart below). Because of this, when out-of-state buyers look to settle someplace in Florida with warm winters near a beach, Brevard County still looks quite attractive to them. However, if the MSI’s don’t come down considerably over the course of the next two months, a drop in prices will be much more likely to occur
Additional Housing Data to Consider
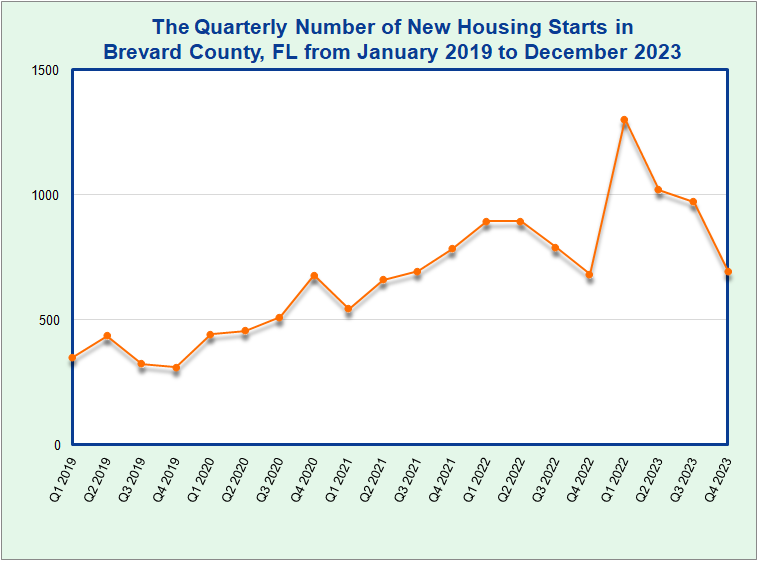
The following graph shows the number of new housing starts in Brevard County from 2019 through 2023. The first thing to note is that, for the most part, the data we pull biweekly does not include new homes being built because the majority of builders never list their inventory on the Multiple Listing Service (MLS). The graph below reflects the number of permits that were pulled to build residences. Figure that a home may take about 9 months from the time the permit is pulled until it is finished. That means that the homes that were started in the first quarter of 2023 have likely just recently been completed. However, what we don’t know is how many of those homes were spec houses versus custom builds. A spec house is one that is built without a buyer agreeing to purchase it. These homes are typically sold just before they are finished. So, a spec home start will affect the real estate supply about 6-9 months later, but a custom home start will affect the demand for resale homes at the time they are started (ie. buyers are choosing to build instead of buying now). The bottom line is that while we can’t fully understand the timing of when these new home starts will affect existing home sales, we know that they do have an effect.
Check back every two weeks to keep up-to-date on the status of the Brevard County real estate market, and feel free to contact us with any questions, comments, or real estate needs.